Libros con envío 1 día | Envío GRATIS* a Península por tiempo limitado +  ¡Ver más!

menú

0
  • argentina
  • chile
  • colombia
  • españa
  • méxico
  • perú
  • estados unidos
  • internacional
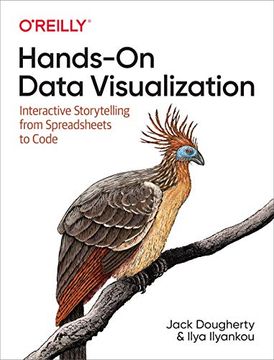
portada Hands-On Data Visualization: Interactive Storytelling From Spreadsheets to Code (en Inglés)
Formato
Libro Físico
Editorial
Año
2021
Idioma
Inglés
N° páginas
275
Encuadernación
Tapa Blanda
Dimensiones
23.1 x 17.5 x 2.8 cm
Peso
0.74 kg.
ISBN13
9781492086000
N° edición
1

Hands-On Data Visualization: Interactive Storytelling From Spreadsheets to Code (en Inglés)

Jack Dougherty (Autor) · Ilya Ilyankou (Autor) · O'Reilly Media · Tapa Blanda

Hands-On Data Visualization: Interactive Storytelling From Spreadsheets to Code (en Inglés) - Dougherty, Jack ; Ilyankou, Ilya

Libro Nuevo

58,87 €

61,97 €

Ahorras: 3,10 €

5% descuento
  • Estado: Nuevo
  • Quedan 2 unidades
Origen: Reino Unido (Costos de importación incluídos en el precio)
Se enviará desde nuestra bodega entre el Lunes 13 de Mayo y el Jueves 23 de Mayo.
Lo recibirás en cualquier lugar de España entre 1 y 5 días hábiles luego del envío.

Reseña del libro "Hands-On Data Visualization: Interactive Storytelling From Spreadsheets to Code (en Inglés)"

Tell your story and show it with data, using free and easy-to-learn tools on the web. This introductory book teaches you how to design interactive charts and customized maps for your website, beginning with simple drag-and-drop tools such as Google Sheets, Datawrapper, and Tableau Public. You'll also gradually learn how to edit open source code templates like Chart.js, Highcharts, and Leaflet on GitHub. Hands-On Data Visualization takes you step-by-step through tutorials, real-world examples, and online resources. This practical guide is ideal for students, nonprofit organizations, small business owners, local governments, journalists, academics, and anyone who wants to take data out of spreadsheets and turn it into lively interactive stories. No coding experience is required. Build interactive charts and maps and embed them in your website Understand the principles for designing effective charts and maps Learn key data visualization concepts to help you choose the right tools Convert and transform tabular and spatial data to tell your data story Edit and host Chart.js, Highcharts, and Leaflet map code templates on GitHub Learn how to detect bias in charts and maps produced by others

Opiniones del libro

Ver más opiniones de clientes
  • 0% (0)
  • 0% (0)
  • 0% (0)
  • 0% (0)
  • 0% (0)

Preguntas frecuentes sobre el libro

Todos los libros de nuestro catálogo son Originales.
El libro está escrito en Inglés.
La encuadernación de esta edición es Tapa Blanda.

Preguntas y respuestas sobre el libro

¿Tienes una pregunta sobre el libro? Inicia sesión para poder agregar tu propia pregunta.

Opiniones sobre Buscalibre

Ver más opiniones de clientes